San Diego School District Rankings 2026: What the California School Dashboard and CAASPP Results Show for Del Mar, San Dieguito, Poway, and San Diego Unified

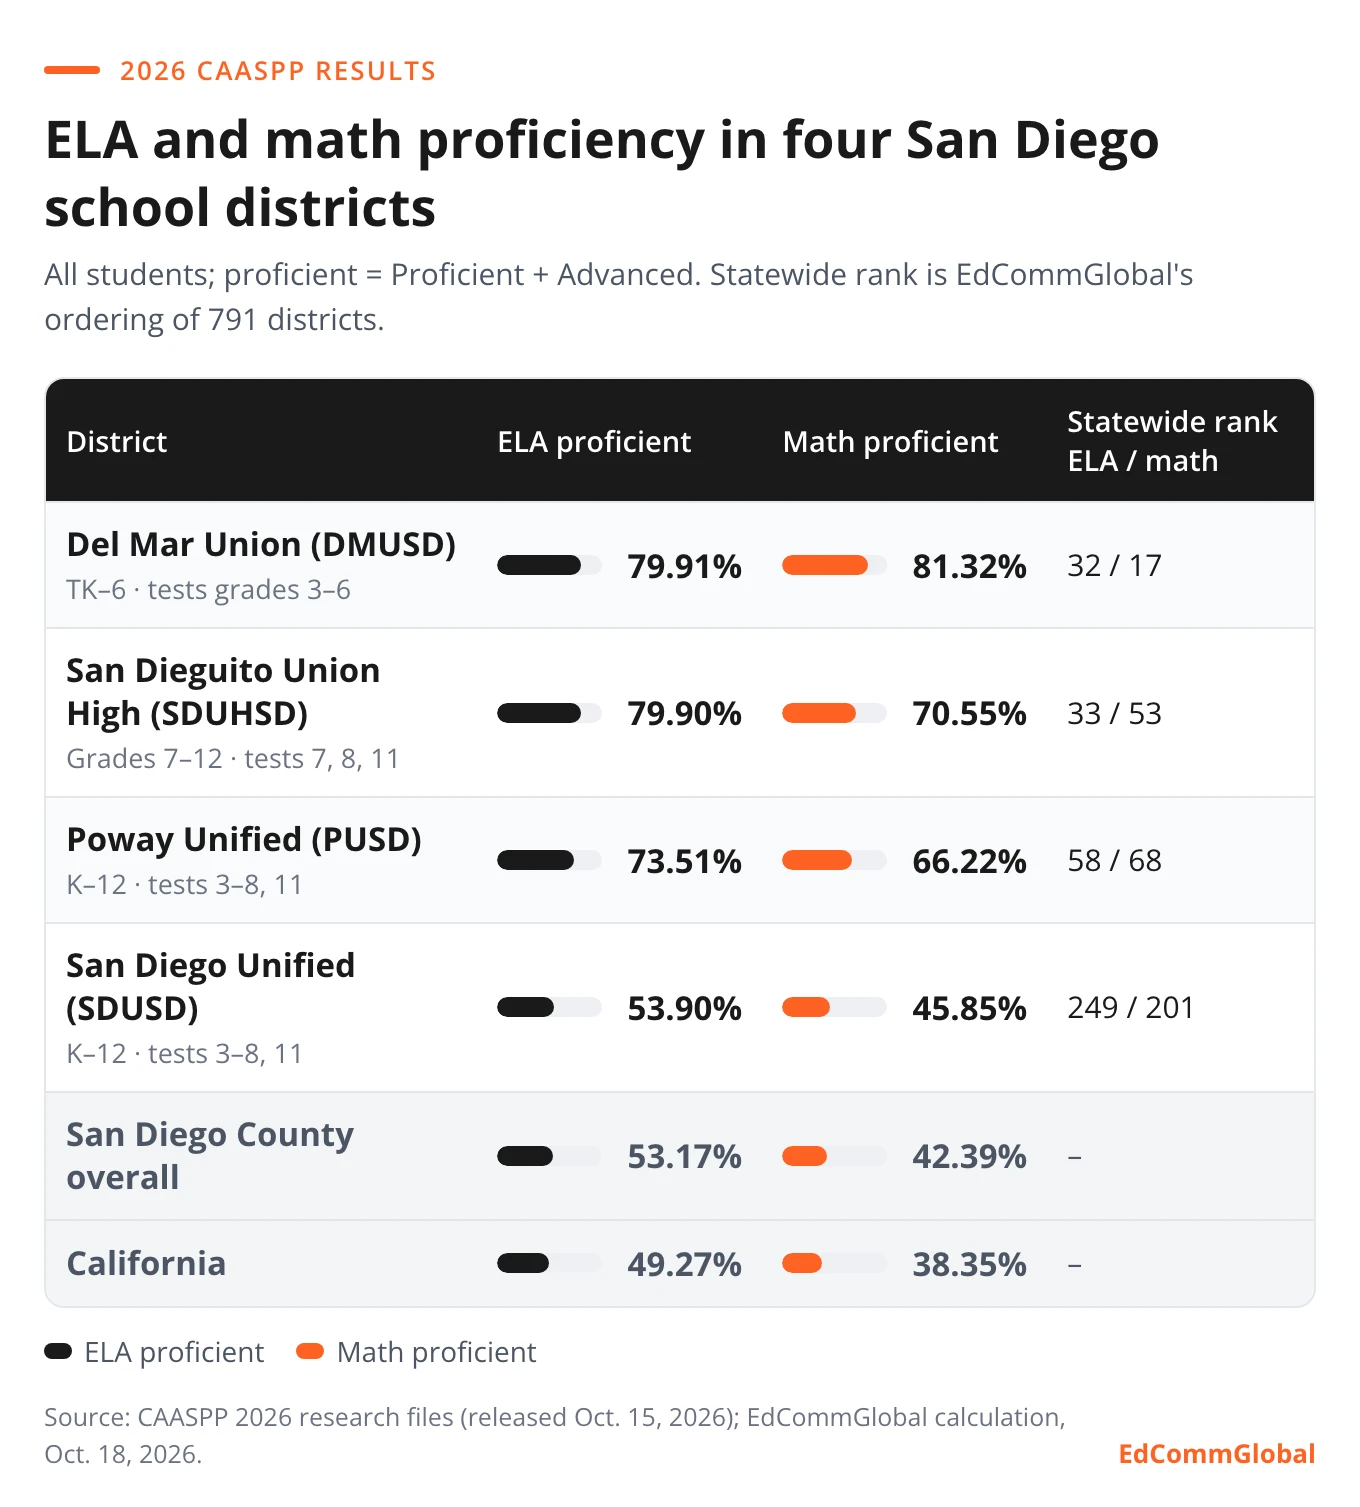
Short answer: In San Diego school district rankings based on the 2026 CAASPP results the California Department of Education released on October 15, 2026, the share of students meeting the standard in English and math was 79.91% and 81.32% in Del Mar Union, 79.90% and 70.55% in San Dieguito Union High (SDUHSD), 73.51% and 66.22% in Poway Unified, and 53.90% and 45.85% in San Diego Unified, all above the statewide 49.27% and 38.35%. The district average is only a starting point: the gap between schools inside one district is often larger than the gap between districts.
We wrote this for parents who are still living abroad and thinking about bringing a child back to a San Diego public school. Using the state's own data files, we break "which district is best" into three practical questions: what each number measures, where the district average and individual schools part ways, and which district and school stage matter for the grade your child will enter.
People say the North County districts are the best and San Diego Unified is "just above the state average." What does that actually mean for my child?
What changed in 2026: test scores and the Dashboard came out on the same day
On October 15, 2026, the California Department of Education (CDE) released two things together:
- CAASPP results. CAASPP (California Assessment of Student Performance and Progress) is the spring statewide test. Students in grades 3–8 and 11 take English language arts (ELA) and math, and scores are reported in four achievement levels. The "proficiency rate" is the share of students at Level 3 or Level 4.
- The California School Dashboard. This is the state's accountability tool. It gives each district and school one of five colors on each indicator: ELA, math, graduation rate, chronic absenteeism, suspension rate, college/career readiness, and English learner progress.
In past years the Dashboard usually came out in December, after the test scores. Under the CDE's new schedule, both are released together on October 15 starting in 2026, with additional reports in a supplemental release on December 15.
One change to watch on this year's score reports: starting with 2025–26 results, the four CAASPP levels were renamed. Standard Exceeded, Standard Met, Standard Nearly Met, and Standard Not Met are now Advanced, Proficient, Developing, and Minimal. According to the official CAASPP guidance, only the labels and descriptions changed; cut scores did not, and results remain comparable to prior years. "Proficient" on your child's report means what "Standard Met" used to mean.
San Diego school district rankings 2026: the four districts families ask about most
The table below shows 2026 CAASPP results for all students, calculated from the official CAASPP research files downloaded on October 18, 2026. "Statewide rank" is our own ordering of 791 California districts by proficiency rate (districts with at least 100 tested students, excluding county offices of education and State Board of Education charters).
| District | Grades served | Grades tested | ELA proficient | Math proficient | Statewide rank (ELA / math) |
|---|---|---|---|---|---|
| Del Mar Union (DMUSD) | TK–6 | 3–6 | 79.91% | 81.32% | 32 / 17 |
| San Dieguito Union High (SDUHSD) | 7–12 | 7, 8, 11 | 79.90% | 70.55% | 33 / 53 |
| Poway Unified (PUSD) | K–12 | 3–8, 11 | 73.51% | 66.22% | 58 / 68 |
| San Diego Unified (SDUSD) | K–12 | 3–8, 11 | 53.90% | 45.85% | 249 / 201 |
| San Diego County overall | 53.17% | 42.39% | |||
| California | 49.27% | 38.35% |
As a share of all districts, Del Mar Union and SDUHSD are in roughly the top 5% statewide in ELA, Poway Unified is in roughly the top 8%, and San Diego Unified is in the top third.
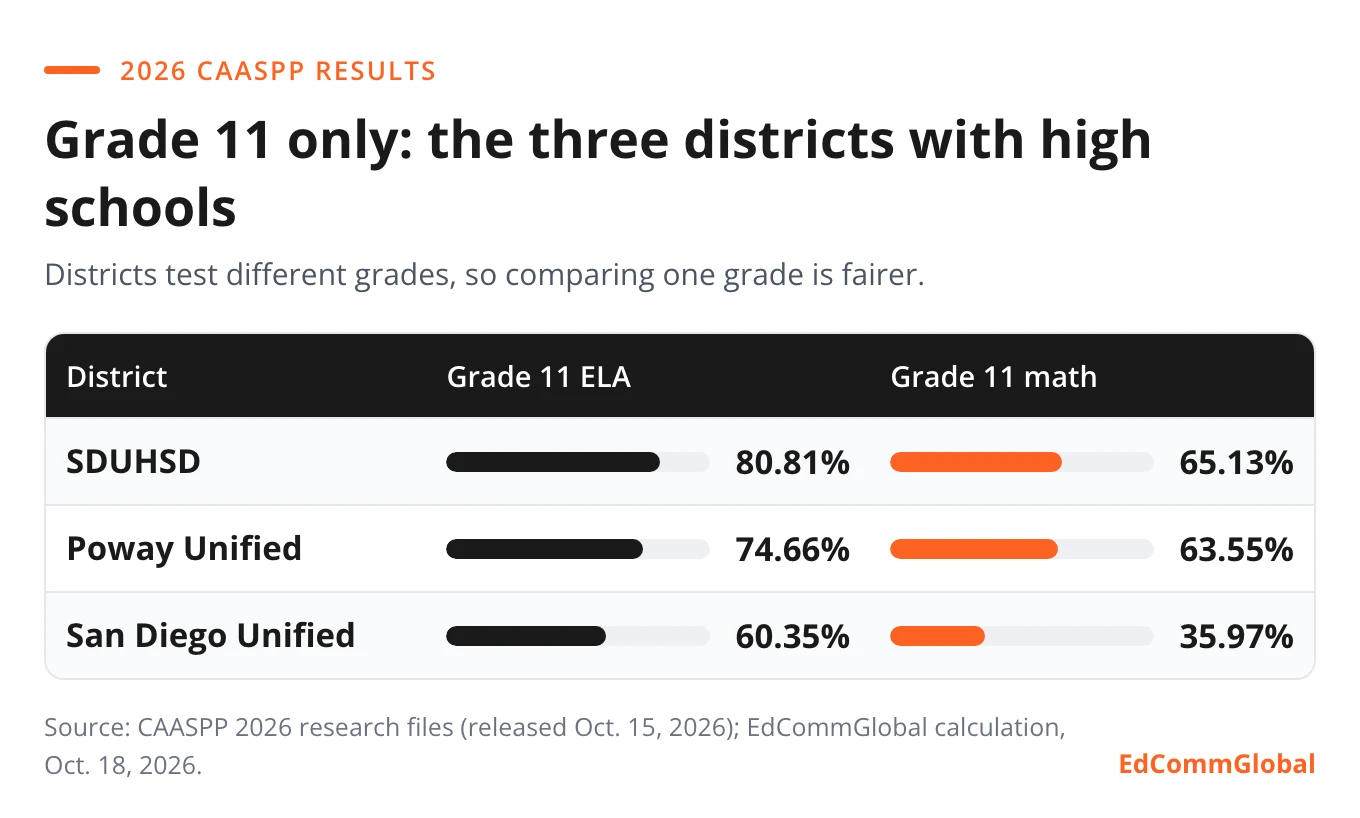
Read the table together with district type. A school district is the local agency that runs the public schools in an area. San Diego County has 42 districts: 13 unified (K–12) districts, 6 high school districts, and 23 elementary districts. Each type tests different grades, so averages are not directly comparable. SDUHSD's math average, for example, includes grades 7 and 8; in grade 11 alone its math proficiency rate is 65.13%. Comparing grade 11 only across the three districts with high schools:
| District | Grade 11 ELA proficient | Grade 11 math proficient |
|---|---|---|
| SDUHSD | 80.81% | 65.13% |
| Poway Unified | 74.66% | 63.55% |
| San Diego Unified | 60.35% | 35.97% |
The highest ELA rates in the county actually belong to small elementary districts: Rancho Santa Fe Elementary (88.41%) and Solana Beach Elementary (83.01%), followed by Del Mar Union and SDUHSD. Only 345 Rancho Santa Fe students were tested, and small districts swing more from year to year.
California School Dashboard 2026: how to read the colors
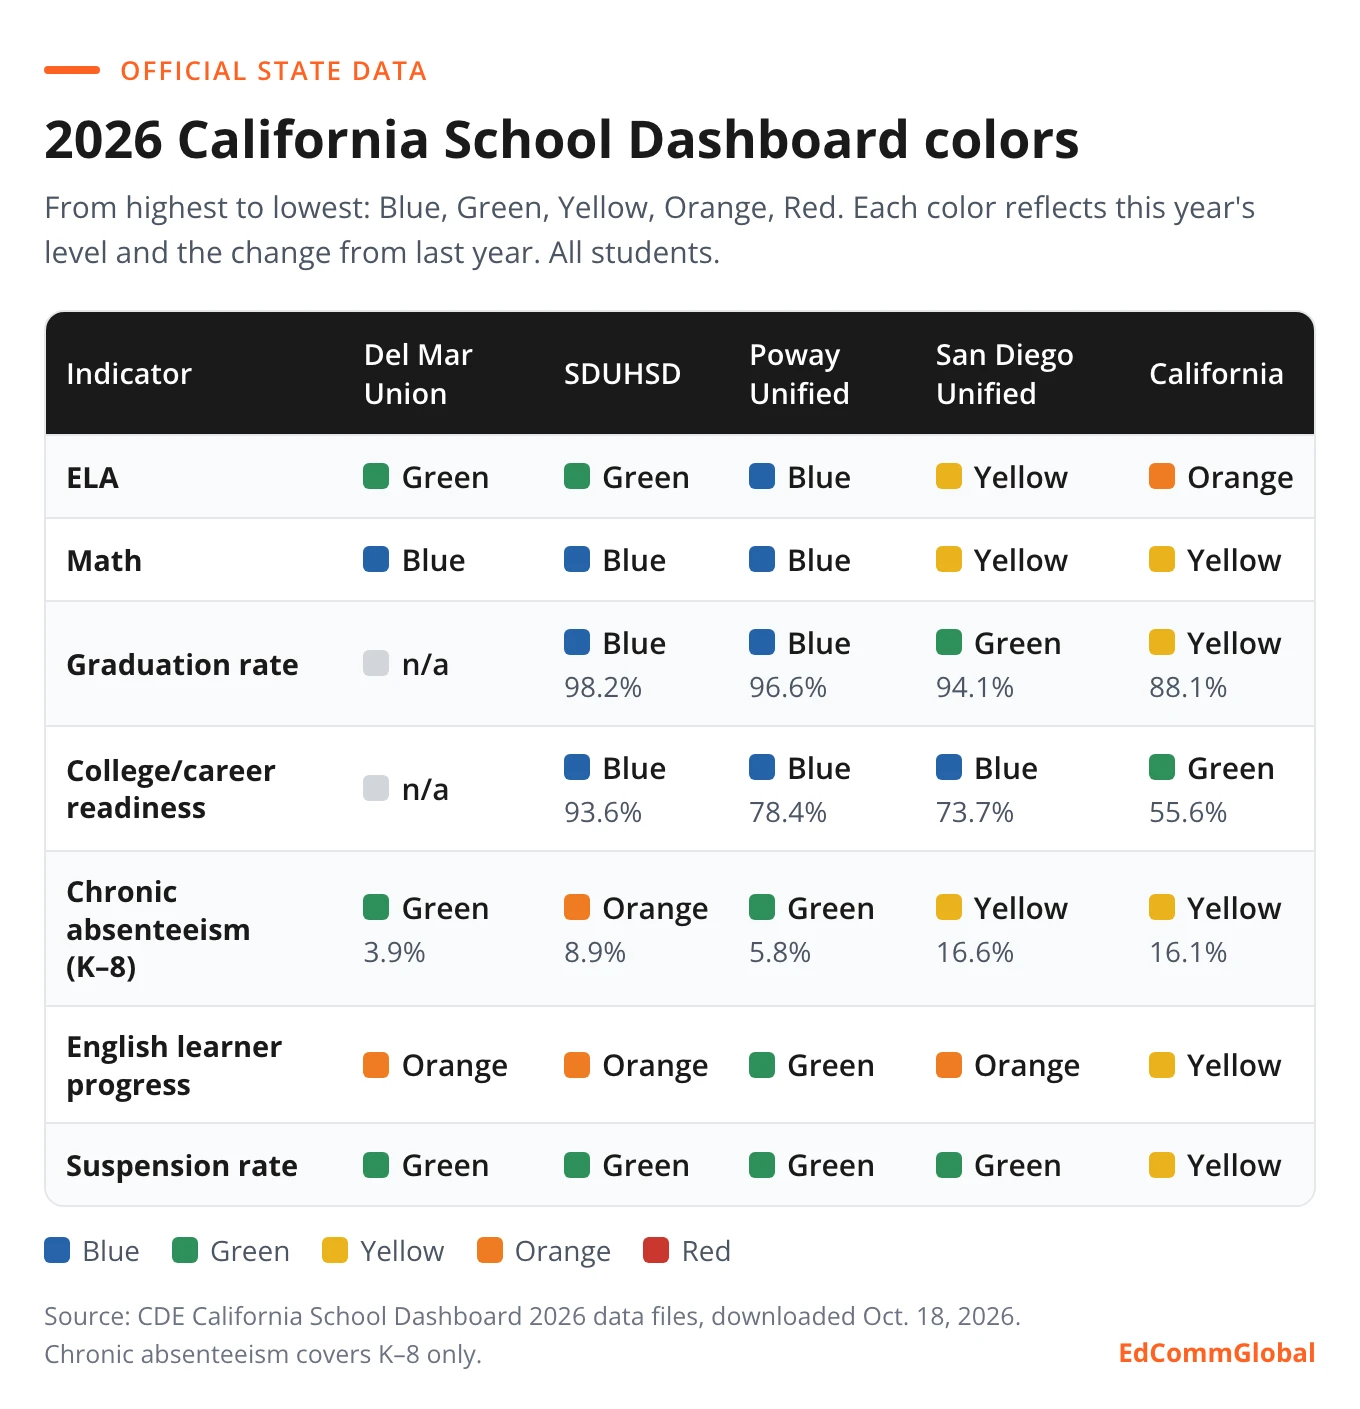
Dashboard colors run from Blue (highest) through Green, Yellow, and Orange to Red. Each color combines two things: this year's level and the change from last year. A district with very high scores that declined can land on Green instead of Blue.
Key 2026 indicators for all students:
| Indicator | Del Mar Union | SDUHSD | Poway Unified | San Diego Unified | California |
|---|---|---|---|---|---|
| ELA | Green | Green | Blue | Yellow | Orange |
| Math | Blue | Blue | Blue | Yellow | Yellow |
| Graduation rate | n/a | Blue, 98.2% | Blue, 96.6% | Green, 94.1% | Yellow, 88.1% |
| College/career readiness | n/a | Blue, 93.6% | Blue, 78.4% | Blue, 73.7% | Green, 55.6% |
| Chronic absenteeism (K–8) | Green, 3.9% | Orange, 8.9% | Green, 5.8% | Yellow, 16.6% | Yellow, 16.1% |
| English learner progress | Orange | Orange | Green | Orange | Yellow |
| Suspension rate | Green | Green | Green | Green | Yellow |
What stands out:
- Poway Unified is Blue or Green on all seven indicators. Among the county's 13 unified districts, it is the only one to do that in 2026.
- San Diego Unified posted a record graduation rate. Its Dashboard graduation rate was 94.1%, up 3.8 points, and college/career readiness was Blue, up 6.6 points. Discussing college preparedness, board president Richard Barrera told CBS 8 that students taking college courses in high school and career pathway sequences played a role. The same data show ELA declined from last year and English learner progress was Orange; the district said a new literacy curriculum will launch next school year.
- North County districts have Orange too. SDUHSD is Orange on chronic absenteeism (grades 7–8 only) and English learner progress, and Del Mar Union is Orange on English learner progress.
That last point matters most for children arriving from overseas. English learner progress measures how much students identified as English learners improved in English over the year. If a child's Home Language Survey lists Chinese or another language, the school will usually give the Initial ELPAC (English Language Proficiency Assessments for California), which decides whether the child is classified as an English learner and what support they receive. An Orange color means English learners in that district as a whole progressed more slowly than the state expects, so it is worth asking each school directly how it supports students still building English. For the enrollment steps, see our San Diego public school guide for returning students.
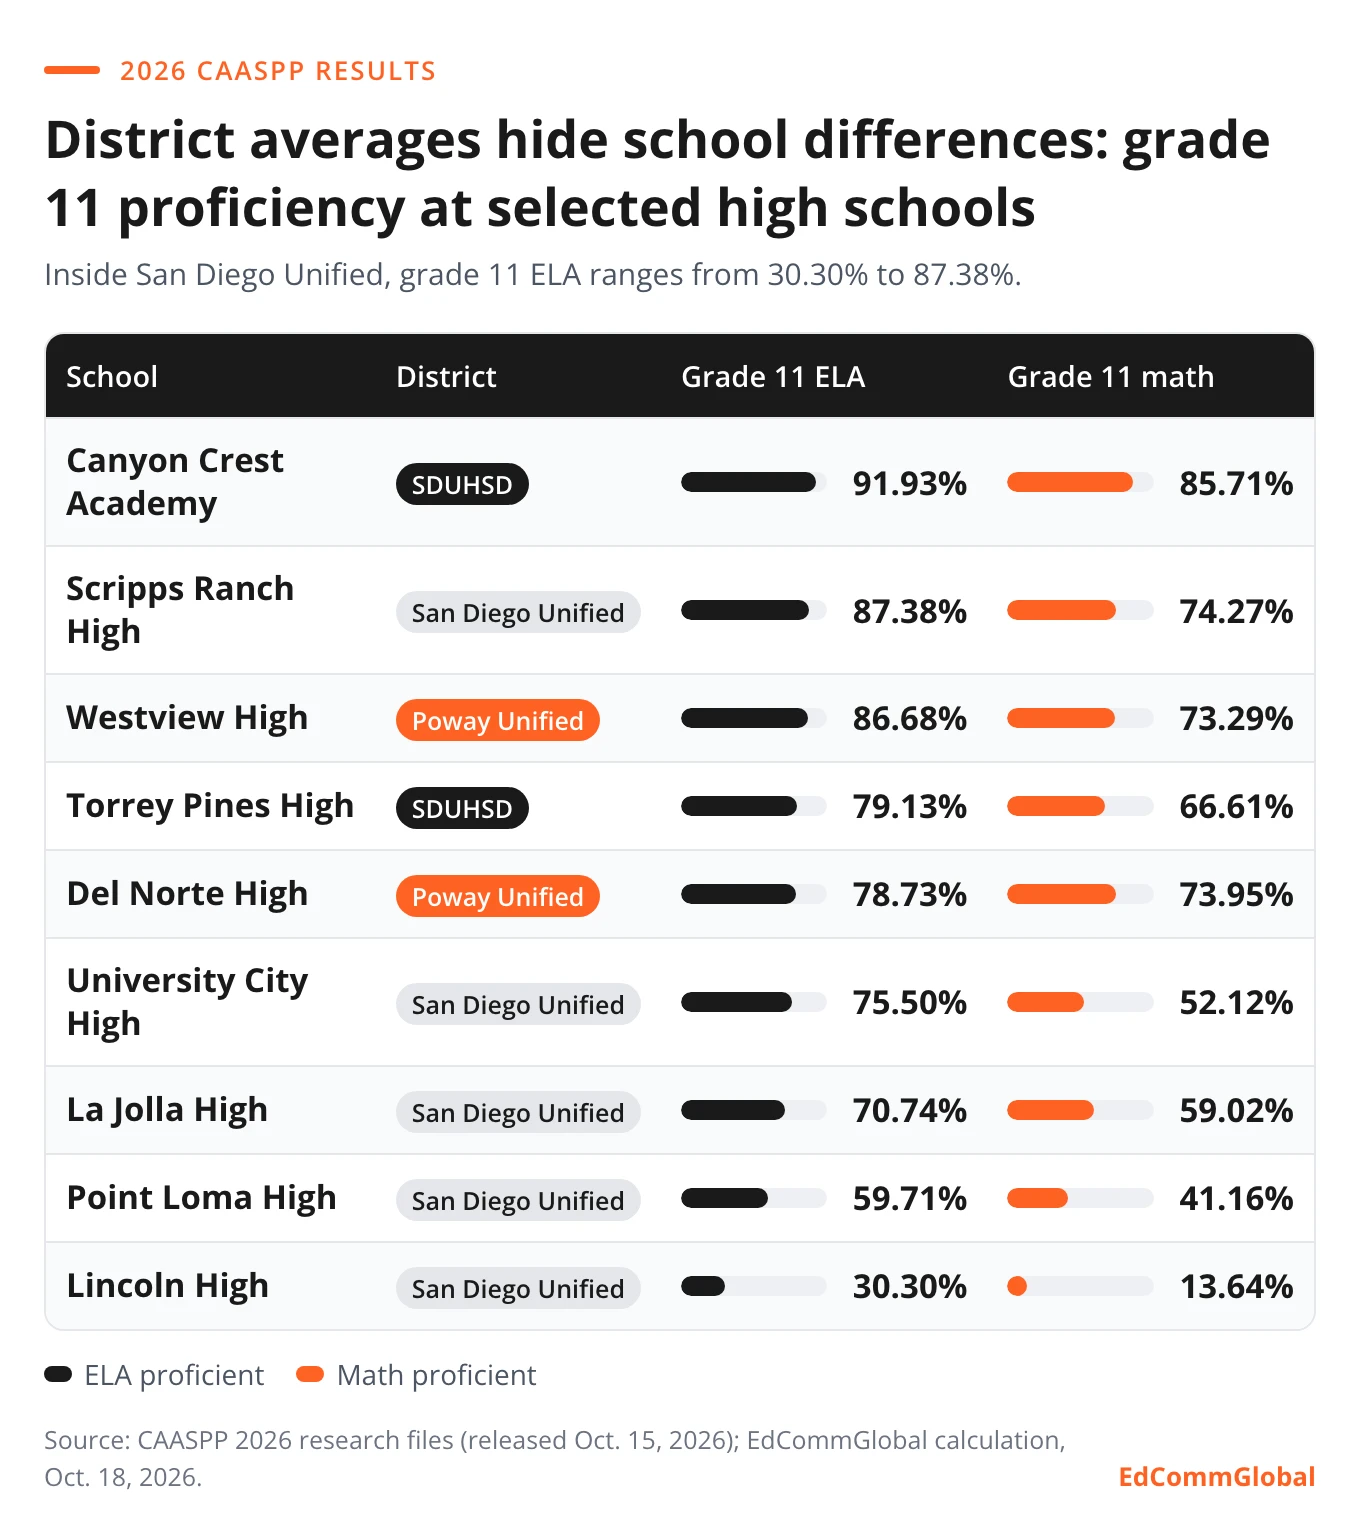
District averages hide school differences: grade 11 ELA from 30% to 87% inside one district
About 44,800 San Diego Unified students took the 2026 ELA test, the second-largest number of any California district after Los Angeles Unified. The district spans very different neighborhoods, and its average flattens those differences.
Grade 11 CAASPP proficiency at selected high schools, 2026:
| School | District | Grade 11 ELA | Grade 11 math |
|---|---|---|---|
| Canyon Crest Academy | SDUHSD | 91.93% | 85.71% |
| Scripps Ranch High | San Diego Unified | 87.38% | 74.27% |
| Westview High | Poway Unified | 86.68% | 73.29% |
| Torrey Pines High | SDUHSD | 79.13% | 66.61% |
| Del Norte High | Poway Unified | 78.73% | 73.95% |
| University City High | San Diego Unified | 75.50% | 52.12% |
| La Jolla High | San Diego Unified | 70.74% | 59.02% |
| Point Loma High | San Diego Unified | 59.71% | 41.16% |
| Lincoln High | San Diego Unified | 30.30% | 13.64% |
Within San Diego Unified, Scripps Ranch High's grade 11 ELA rate (87.38%) is higher than Torrey Pines in SDUHSD, while Lincoln High's is 30.30%. Districts differ by about 20 points; schools inside one district differ by more than 50. Elementary schools show the same pattern: in Del Mar Union, Ocean Air Elementary posted 84.86% in ELA and 89.76% in math, and Sage Canyon 82.76% and 85.66%, both above the district average.
So after "where does this district rank," the next question is "which school does our address map to, and what are that school's numbers." Official address lookups for each district are collected on our San Diego school districts page.
Four mistakes families make when reading San Diego district rankings from overseas
These are EdCommGlobal's observations from comparing districts with families here.
1. Treating proficiency rates as a "teaching quality score." Proficiency tracks family income and parent education closely. Voice of San Diego's income-versus-test-score metric removes much of that effect before comparing schools; our breakdown shows how. A high rate tells you classmates arrive well prepared. How well the school itself teaches shows up in growth and course offerings.
2. Looking at the district name instead of the address. Most public schools assign students by attendance boundary. Living in Poway Unified does not guarantee Westview, and living in SDUSD does not guarantee Scripps Ranch. Transfers inside SDUSD go through School Choice, with no guaranteed seat; see SDUSD School Choice for 2027–28. CCA in SDUHSD admits through the district's High School Selection; the risks are covered in address boundaries and School Choice.
3. Ranking elementary and high school districts against each other. Del Mar Union ends at grade 6, and its students continue to SDUHSD in grade 7. Both score high, but they are two stages of one path, not a choice between two.
4. Reading only this year's colors. Colors include year-over-year change, so one down year can move a district from Blue to Green, and one strong year can lift Orange to Yellow. Two or three years of the same indicator tell you more. Higher-scoring schools also mean stronger peer competition; for a child still building English, whether the school offers support matters as much as the score.
Which district to look at, by the grade your child returns
Elementary (K–6). In Carmel Valley and Del Mar, elementary schools usually belong to Del Mar Union or the Solana Beach School District (listed as Solana Beach Elementary in state data), and students move to SDUHSD after grade 6. Choosing where to rent or buy there sets both the elementary district and the middle and high school district. For checking addresses and leases, see Carmel Valley 92130 elementary enrollment. Poway Unified and San Diego Unified are unified districts, so one district runs elementary through high school.
Middle school (grades 6–8). SDUHSD starts at grade 7. A child returning in grade 6 spends a year in an elementary district before moving to an SDUHSD middle school such as Carmel Valley Middle School or Pacific Trails Middle School. A child returning in grade 8 will meet SDUHSD's High School Selection, on the timeline the district publishes each year; see why grade 8 is a common window for returning students.
Grade 9. High school district numbers matter most here, but they still need to land on a school. Districts with the same Blue rating run high schools with different pacing and support; compare four of them in our San Diego public high schools guide.
Grade 10 and later. District rankings matter less. What matters more is how coursework from abroad converts to credits, which math level your child places into, and whether their English is ready for grade 11 classes. If you are weighing this year or next, start with returning to a US school now or next year.
Whatever the grade, work backward from the first day of school to prepare enrollment documents; see the San Diego public school enrollment documents checklist.
How to check school and district results yourself: three steps
- Look up test results. On the official CAASPP results site, choose 2026 and search for a school or district to see proficiency by grade and student group. EdSource's CAASPP database is another way to search by school.
- Look up Dashboard colors. On the California School Dashboard, search for a school or district to see each indicator's color, this year's number, and the change from last year. English learner progress and chronic absenteeism are especially useful for newly arriving students.
- Put the numbers back on a school. Note the school's numbers and where it sits within its district, then read its course catalog and ask about English support and course placement when you visit. Our 20 school visit questions are ready to bring along.
Your child's own CAASPP Student Score Report comes from the district, usually through its parent portal or by mail; ask your child's school.
How EdCommGlobal can help
EdCommGlobal is a San Diego-based K-12 education planning and local support team. When it comes to choosing a district and school, here is what we do:
- Before you decide: learn your child's grade, English level, return timeline, and family budget, then map district numbers onto specific addresses and schools and lay out two or three workable options, without rushing to one.
- Preparing to enroll: check which school an address maps to and the district's rules, organize enrollment documents, and work backward from the start date.
- After enrollment: within the agreed scope of service, follow your child's academic and daily adjustment and help parents communicate with the school. See student support.
We do not make promises on behalf of districts or schools; school assignments and transfer decisions belong to the district. We do not give real estate or legal advice. Scores and colors change every year, so we date every number, and we ask families to check the CAASPP and Dashboard sites once more before deciding.
To compare districts together, contact EdCommGlobal and tell us your child's current grade, the year you plan to return, the part of San Diego you are considering (it is fine if you have not decided), and how your child's English is today.
FAQ
What are the San Diego County school district rankings for 2026?
The state does not rank districts, but by 2026 CAASPP proficiency, the top of San Diego County is led by small elementary districts (Rancho Santa Fe, Solana Beach, Del Mar Union), then SDUHSD (79.90% ELA, 70.55% math) and Poway Unified (73.51%, 66.22%). San Diego Unified posted 53.90% and 45.85%, above the county (53.17%, 42.39%) and state (49.27%, 38.35%). Out of 791 California districts, our ranking places SDUHSD 33rd in ELA, Poway 58th, and San Diego Unified 249th.
What is the best school district in San Diego?
Among districts with high schools, SDUHSD has the highest 2026 CAASPP proficiency rates, and among unified K–12 districts Poway Unified is highest and the only one in the county that is Blue or Green on all seven Dashboard indicators. "Best" still depends on your address, your child's entry grade, and the specific school that address maps to; inside San Diego Unified, Scripps Ranch High outscored Torrey Pines in grade 11 ELA.
What are the best school districts in San Diego County for elementary school?
By 2026 CAASPP proficiency, Rancho Santa Fe Elementary (88.41% ELA, 86.21% math), Solana Beach Elementary (83.01%, 81.72%), and Del Mar Union (79.91%, 81.32%) lead the county. In Del Mar Union, Ocean Air Elementary posted 84.86% in ELA and 89.76% in math. Elementary seats follow your address, so confirm the assigned school first.
When were the 2026 CAASPP results released?
The CDE released 2026 statewide CAASPP results together with the 2026 California School Dashboard on October 15, 2026, the first year the two were aligned. A supplemental release with additional Dashboard reports is scheduled for December 15, 2026. Individual Student Score Reports are sent by each district.
What were the 2026 CAASPP results statewide?
Statewide, 49.27% of California students met or exceeded the ELA standard in 2026, up 0.46 points from 2025, and 38.35% did so in math, up 1.05 points, according to the CAASPP research files (matching EdSource's database). More than half of students are still below Proficient in each subject.
How do I check CAASPP results for 2026?
For school and district results, go to caaspp-elpac.ets.org, select 2026, and search by school or district name. For your own child's score, check your district's parent portal or ask the school for the Student Score Report. Dashboard colors for the same school are at caschooldashboard.org.
What is the California School Dashboard?
The California School Dashboard is the state's accountability website for public schools and districts. It reports each indicator separately (ELA, math, graduation rate, chronic absenteeism, suspension rate, college/career readiness, English learner progress) with one of five colors, and does not combine them into a single score or rank.
What do the California School Dashboard colors mean?
From highest to lowest, the colors are Blue, Green, Yellow, Orange, and Red. Each color reflects both the current level and the change from the prior year, so a high-performing district that declined can show Green, and a middling one that improved a lot can move up a color.
Do CAASPP scores matter?
CAASPP is mainly used to hold schools accountable. It does not count toward a student's GPA and is not part of college applications. It still helps families in two ways: it shows how far your child is from grade-level standards, and scoring Proficient or above on the grade 11 ELA test is one way to demonstrate English for the State Seal of Biliteracy. English learners in their first 12 months in a US school can be exempted from one administration of the ELA test, as arranged by the district.
How did San Diego Unified do on its 2026 test scores?
San Diego Unified posted 53.90% proficiency in ELA (down 2.27 points from 2025) and 45.85% in math (up 0.55), above state averages. Its Dashboard graduation rate rose to 94.1% and college/career readiness was Blue, while English learner progress was Orange. School results vary widely, from 30.30% (Lincoln High) to 87.38% (Scripps Ranch High) in grade 11 ELA.
What are Poway Unified's test scores?
Poway Unified posted 73.51% proficiency in ELA and 66.22% in math in 2026, roughly the top 8% of California districts. It was Blue or Green on all seven Dashboard indicators, with a 96.6% graduation rate. Westview High's grade 11 ELA rate was 86.68% and Del Norte High's 78.73%; see our Westview profile.
What is the Del Mar Union School District?
Del Mar Union is a TK–6 elementary district serving Del Mar and much of Carmel Valley; students continue to SDUHSD in grade 7. In 2026 it posted 79.91% proficiency in ELA and 81.32% in math, 17th of 791 California districts in math, with Blue in math and Green in ELA on the Dashboard.
How many school districts are in San Diego County?
San Diego County has 42 school districts in the 2026 Dashboard data, not counting the County Office of Education: 13 unified (K–12), 6 high school, and 23 elementary districts.
Sources and how we checked
- 2026 CAASPP Smarter Balanced research file (all students,
sb_ca2026_1_csv_v1, with the entity names file) from the official CAASPP research files page, downloaded October 18, 2026. Statewide ranks are EdCommGlobal's ordering by "Percentage Proficient and Above," district level only (type 6), at least 100 students with scores, excluding county offices of education and State Board of Education charters: 791 districts. Participation at the schools listed was mostly 93%–100%, and 90% at Del Norte High. - EdSource CAASPP Smarter Balanced database (statewide, SDUSD, SDUHSD, and Poway Unified pages), cross-checked October 18, 2026.
- 2026 California School Dashboard data files (ELA, math, graduation, chronic absenteeism, college/career, English learner progress, suspension) from the CDE Dashboard downloads, October 18, 2026. Color codes 1–5 map to Red, Orange, Yellow, Green, Blue, verified against Poway Unified's Blue ELA rating in 2025. The Dashboard graduation indicator differs from the four-year rate in the CDE news release: 88.1% versus 87.9% statewide.
- CDE 2026 Aligned Release Letter (same-day October 15 release) and Aligned Dashboard and Assessment Data Release (December 15 supplemental release). The CDE site blocks automated requests, so we checked its indexed page text, October 18, 2026.
- Renamed achievement levels: CAASPP email update of May 7, 2026 and ETS What's New in 2025–26 (no cut score changes, comparable to prior years), October 18, 2026.
- San Diego Unified graduation rate and board president comments: CBS 8 (KFMB) report syndicated on Yahoo News, October 16, 2026, accessed October 18, 2026.
- Grade 11 CAASPP ELA option for the State Seal of Biliteracy: CDE requirements flyer (August 2024, written as "standard met," now Proficient). First-12-month ELA exemption for recently arrived English learners: CDE CALPADS guidance and district testing policies, October 18, 2026. Follow your district's arrangements.
- District count and type from the 2026 Dashboard data for San Diego County, excluding the County Office of Education.
- All figures are for all students. Proficiency reflects community income, student population, and participation, not the whole of a school's quality. School assignment follows each district's official address lookup.
Related reading

San Diego High School Rankings: Best Public and Private High Schools on Niche 2027, and How U.S. News and GreatSchools Differ
See the Niche 2027 top 10 public and private high schools in the San Diego area (checked Oct. 18, 2026), what Niche, U.S. News, GreatSchools, and the California School Dashboard measure, and four steps to turn San Diego high school rankings into a shortlist.

San Diego Private Schools: 10 K-12 Schools by Grade, Campus, Tuition, and How to Apply
Which San Diego private schools cover elementary, middle, and high school, what tuition looks like in 2026–27, how to apply, and what changes for US-born children returning from China versus F-1 students.

San Diego Private High Schools Guide: Tuition, Rankings, Deadlines, and SSAT vs ISEE at 10 Schools
Which San Diego private high schools to consider, what they cost, and when to apply: ten schools compared by tuition, affiliation, and 2027–28 deadlines, plus SSAT vs ISEE, application materials, interviews, financial aid, and 10th-grade entry.