LJCDS Class of 2026 Matriculation: Where Did 108 Graduates Go?
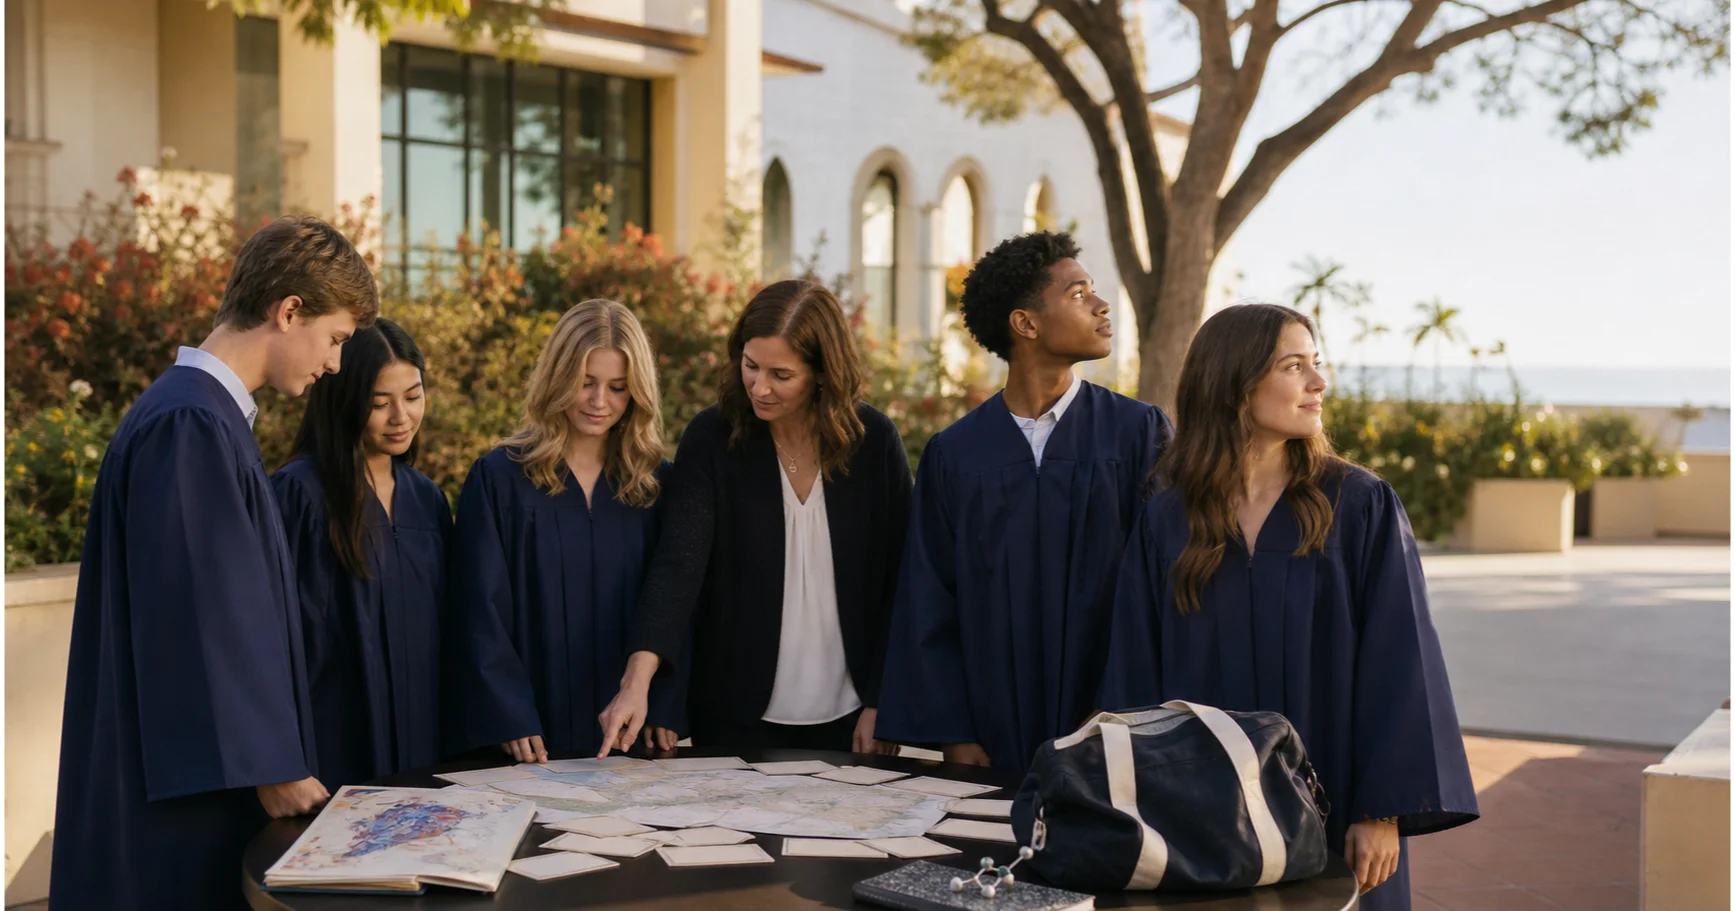
Short answer: LJCDS officially reports 108 graduates in the Class of 2026. Its matriculation list reconciles to 107 students attending 68 institutions, with one additional graduate taking a gap year. The largest single destination has only six students, showing broad dispersion. This is a final-enrollment list—not an admission rate or a promise of outcomes for future applicants.
This article answers two questions: where did the LJCDS Class of 2026 enroll, and what does that data mean for families comparing San Diego public and private schools?
Reconcile the 108 graduates first
| Official information | Figure | Correct interpretation |
|---|---|---|
| Class of 2026 graduates | 108 | Full graduating class |
| Published matriculation | 107 students, 68 institutions | Sum of the school-by-school counts; final enrollment |
| Gap year | 1 student | Joining a soccer club in Croatia; outside the 107-student college denominator |
| International universities | 3 students | Two at McGill and one at the University of St Andrews |
| College acceptances | 650+ | Total admission offers, not 650 different institutions |
| Top-three choice | 99% | School reports that 99% were admitted to one of their own top three choices; not an admission rate |
Subtracting the one gap-year graduate from 108 leaves the 107 students on the matriculation list. This official reconciliation is more precise than the preliminary “about 110” and “about 107” figures that circulated earlier.
Class of 2026 destinations by pathway
EdCommGlobal reclassified the official LJCDS matriculation list below. The categories are mutually exclusive and sum to 107 students. Every percentage uses 107 listed matriculants as the denominator and excludes the gap-year graduate.
| Pathway | Students | Institutions | Share of listed matriculants | Examples |
|---|---|---|---|---|
| UC | 11 | 6 | 10.3% | UC Berkeley, UCLA, UCSD |
| CSU / Cal Poly | 4 | 2 | 3.7% | Cal Poly SLO, SDSU |
| California community college | 4 | 4 | 3.7% | Cuyamaca, MiraCosta, Mesa, Miramar |
| California private | 20 | 11 | 18.7% | Stanford, USC, USD, Claremont McKenna |
| Out-of-state public | 16 | 12 | 15.0% | Washington, Colorado Boulder, Oregon State |
| Out-of-state private | 49 | 31 | 45.8% | Northeastern, Boston University, SMU, Tufts |
| International | 3 | 2 | 2.8% | McGill, St Andrews |
| Total | 107 | 68 | 100% | Excludes one gap-year graduate |
The clearest pattern is not one trophy institution. It is geographic and institutional breadth:
- 39 students, or 36.4%, enrolled in California;
- 65 students, or 60.7%, enrolled elsewhere in the United States;
- three students, or 2.8%, enrolled abroad;
- private universities, liberal arts colleges, art and design schools, public universities, and community colleges all appear as real destinations.
The LJCDS applicant pool is therefore not centered only on UC, and UC data cannot summarize the class.
How dispersed are the destinations?
| Students at one institution | Number of institutions | Students represented | Institutions |
|---|---|---|---|
| 6 | 1 | 6 | Northeastern |
| 5 | 2 | 10 | Boston University, University of San Diego |
| 3 | 6 | 18 | Cal Poly SLO, LMU, SMU, UC Berkeley, UC Santa Cruz, University of Washington |
| 2 | 14 | 28 | NYU, McGill, RISD, University of Chicago, and others |
| 1 | 45 | 45 | 45 different institutions |
Northeastern, the largest single destination, accounts for only about 5.6% of the 107 listed matriculants. Another 45 institutions enroll one LJCDS graduate each. “Individual paths are widely distributed” is a stronger reading than “the class concentrates at a few colleges.”
Matriculation is not admission
These terms answer different questions:
| Term | Meaning | Can this article calculate it? |
|---|---|---|
| Acceptance / admit | An offer issued by a college | We know only the classwide 650+ total, not total applications or institution-level admits |
| Admission rate | Admits divided by applications | No |
| Matriculation | The institution a student ultimately attends | Yes; LJCDS publishes 107 destinations |
| Yield | Enrollees divided by admits | No; institution-level admit denominators are missing |
One student at Stanford, Caltech, or Penn means one Class of 2026 graduate ultimately enrolled there. It does not reveal the outcomes of other applicants and cannot predict a future student's admission probability.
How should families read 650+ offers and 99% top-three?
In its Class of 2026 commencement story, LJCDS says the class received 650+ college acceptances and 99% of students were admitted to one of their top three college choices.
Those figures indicate broad choice and a strong reported fit between offers and student preferences, but three boundaries matter:
- They are school-published figures, not a third-party audit.
- The 650+ figure counts offers, not students or unique institutions.
- “Top three” reflects each student's own preference list, not a universal college ranking.
Dividing 650 by 108 shows only a rough classwide magnitude of at least six offers per graduate. The individual distribution may be uneven, so that average is not a personal promise.
What does the small-school counseling model show?
Current LJCDS materials list four full-time college counselors, plus an athletic liaison and college essay coaches. The school also says that:
- juniors and seniors participate in a college seminar;
- counselors meet regularly with students and parents;
- 200+ college representatives visit campus each fall;
- juniors have access to college trips, essay workshops, and college fairs.
These are verifiable parts of the support model. They help explain how the school can serve a broad set of college directions, but they do not prove that counseling alone caused an admission. Student preparation, family choices, budget, academic interests, and application strategy also shape the outcome.
Do not mix the current School Profile with Class of 2026 outcomes
The profile currently linked by LJCDS is the 2026–27 School Profile, which describes the Class of 2027: 114 students, a weighted GPA middle 50% of 3.71–4.34, and an unweighted range of 3.45–3.82. The school has also moved from AP courses to Advanced Studies while continuing to offer AP exams.
That is current context for future applicants, not the Class of 2026 grade distribution. Older SAT, ACT, or GPA-quintile figures should not be presented as current unless the corresponding official profile version remains available and is labeled by year.
What should parents actually compare?
| Family situation | What the 2026 data shows | What still needs verification |
|---|---|---|
| Wants a national college search | 60.7% of listed matriculants enrolled outside California | Student willingness to leave the state, family budget, and travel costs |
| Interested in private universities or liberal arts colleges | California and out-of-state private institutions enroll 69 students | Whether courses, activities, and writing support that direction |
| Focused on UC | 11 students enrolled across six UC campuses | Matriculation is not a UC admission rate |
| Considering art or specialized programs | RISD, SCAD, and other specialized destinations appear | Portfolio preparation, program fit, and cost |
| Returning student still needs English support | Outcome data cannot answer language readiness | The international-applicant page says LJCDS does not offer ESL; confirm the student's applicant category and support plan |
| Expects the school name to produce an outcome | The list provides no individual probability | Return to student profile, course rigor, activity direction, and family capacity |
For US-born Chinese and returning families, the value is not the set of names on the list. It is whether the student can use LJCDS courses, writing instruction, counseling, and community resources to build a coherent path.
How does LJCDS compare with CCA and Torrey Pines?
The three schools do not belong in one “admission-rate ranking.” LJCDS publishes final Class of 2026 matriculation for a 108-student cohort. Public CCA and TPHS reporting is based largely on historical NSC patterns, UC-only source-school data, and school profiles for cohorts of several hundred students.
Start by matching the metric to the question:
- To compare final destinations, use complete matriculation lists.
- To compare UC applications, use the same UC source-school dataset.
- To compare school fit, examine curriculum, scale, counseling, activities, and family budget.
- To estimate individual opportunity, school-level data never replaces the student's own application profile.
FAQ
Is the LJCDS Class of 2026 destination list official?
Yes. LJCDS publishes the list on its 2026 Commencement site. Its commencement story also confirms 108 graduates, 68 institutions, three students enrolling abroad, and one graduate taking a gap year. The pathway categories and percentages in this article are EdCommGlobal calculations from that official list.
Does matriculation include every admission offer?
No. Matriculation records the one institution each student ultimately chose. A student may have received several offers but appears only once in the destination list.
Can 650+ acceptances be used to calculate the LJCDS admission rate?
No. Total applications and institution-level applicant/admit counts are not public. The 650+ figure is a school-reported offer total, not an admission rate.
Why can't small private-school outcomes be compared directly with large public schools?
The denominators and reporting methods differ. LJCDS had 108 graduates and published final destinations. CCA and TPHS have larger graduating classes and primarily publish historical percentages and UC-only tables. A useful comparison must align year, denominator, and metric.
Is LJCDS automatically better for college admission than CCA or TPHS?
No. LJCDS offers a smaller cohort and a clearly described counseling structure. CCA and TPHS provide larger public-school course and activity ecosystems. Fit depends on initiative, course rhythm, English writing, activities, budget, and family logistics.
Source and data verification notes
| Information | Source | How this article uses it |
|---|---|---|
| 108 graduates, 650+ offers, 99% top-three, three abroad, one gap year | LJCDS Class of 2026 commencement story | Official school report; not rewritten as an admission rate. |
| 107 students, 68 institutions, and institution-level counts | LJCDS 2026 Matriculation | Official list; summed and reclassified transparently. |
| Counseling services and team | LJCDS College Counseling, At a Glance | Describes support structure without asserting causation. |
| Current curriculum and GPA context | LJCDS 2026–27 School Profile | Used only for Class of 2027 and current curriculum context, not as 2026 outcomes. |
| ESL and international-applicant boundary | LJCDS International Applicants | Prompts families to verify applicant category and available support. |
| Categories, percentages, and family guidance | The official sources above plus EdCommGlobal planning experience | Calculations and consultant interpretation, not an official school conclusion or admission guarantee. |
Sources were reverified on September 2, 2026.
Related reading
- LJCDS school profile
- The Bishop's School 2026 college profile
- Bishop's, Parker, and LJCDS public-data comparison
- CCA Class of 2026 public-data review
- Torrey Pines Class of 2026 public-data review
- Grade 8: SDUHSD public or private school?
Families who want to place English readiness, course foundation, activity direction, and budget in one school-comparison framework can contact EdCommGlobal for a school-fit review.
Related reading

San Diego Class of 2026 College Outcomes and Pathways: Five Schools Compared
CCA, Torrey Pines, LJCDS, Bishop's, and Parker publish different kinds and years of outcome data. This six-table guide compares school scale, curriculum, evidence, and family fit without turning incompatible metrics into a ranking.

Francis Parker School Class of 2026 Profile: How to Read Its AP and College Pathways
Parker has 124 students in the Class of 2026 and offers 42 Honors and 26 AP courses. As of August 23, 2026, final Class of 2026 destinations were not yet public.

The Bishop's School 2026 College Profile: No AP Explained
The Bishop's School Class of 2026 has 129 students. Learn how its no-AP curriculum, GPA range, 2025 matriculation, and four-year outcomes should be read.