Torrey Pines High School 2026 Data Review: Courses and Outcomes
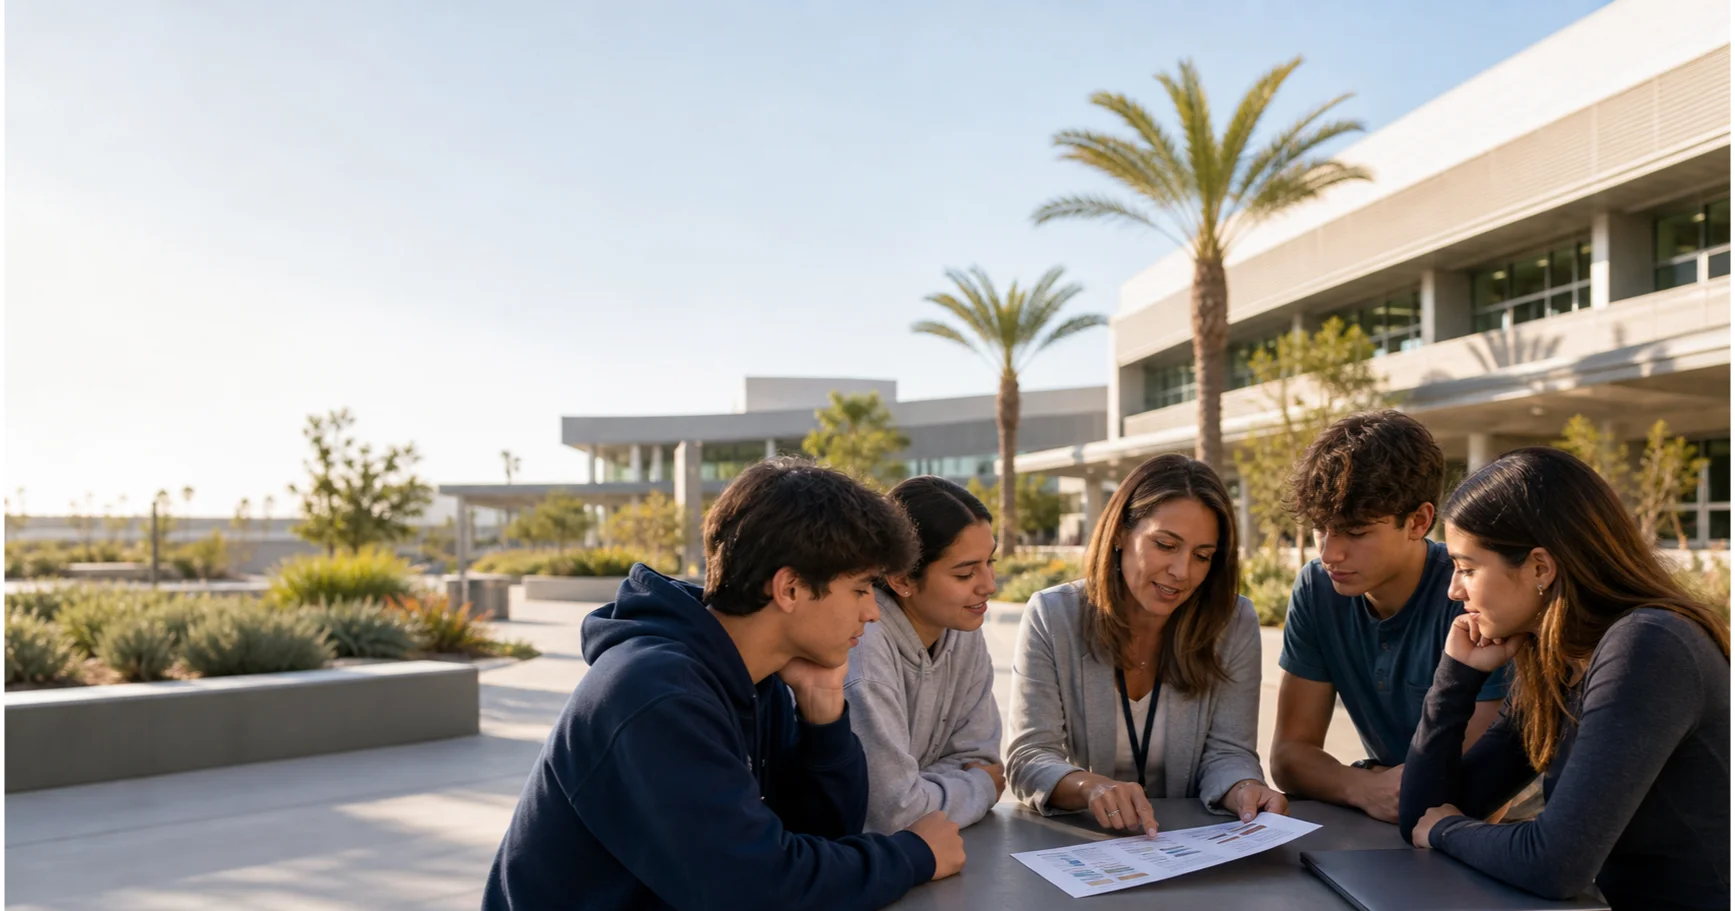
Short answer: Torrey Pines High School (TPHS) has about 620 seniors in the Class of 2026. Its broad academic and extracurricular options include a 90.1% AP qualifying-score rate in 2025. Student fit depends less on that headline number than on whether a student can independently navigate a large campus, yearlong courses, activities, and support systems.
This review uses verifiable school, district, California Department of Education (CDE), and UC Information Center sources. As of August 21, 2026, TPHS had collected Class of 2026 post-high-school plans through its Senior Exit Survey, but it had not published survey results or a complete college matriculation list.
Start with family fit
| Parent question | Public data | What it means for families |
|---|---|---|
| How large is TPHS? | The School Profile lists 2,615 students and 620 seniors; CDE shows 2,642 students in 2025-26 | Resources are broad, but students must actively seek courses, clubs, counseling, and support |
| What is the course rhythm? | Yearlong and semester courses, up to seven classes; most meet in 100-minute blocks, with one daily 55-minute period | The rhythm is more continuous than a 4x4, but several yearlong classes create sustained workload |
| Is the school only academic? | About 150 clubs, 33 varsity sports, and eight CTE pathways | Students can combine academics with athletics, arts, service, and career exploration |
| What does the UC data show? | In 2025: 334 applicants, 236 admits, and 91 enrollees | This is historical UC-system data, not an overall college admit rate |
| Where did the Class of 2026 go? | The school collected a Senior Exit Survey but did not publish aggregate results | Individual announcements and historical data cannot substitute for classwide outcomes |
Scale: broad resources require student initiative
The TPHS 2025-2026 School Profile lists about 2,615 students, including roughly 620 seniors in the Class of 2026. CDE reports 2,642 students for the same school year. The figures are close but not identical, usually because the sources use different reporting dates or definitions.
This is not a small private-school environment. Public school materials list about 150 student clubs and 33 varsity sports. Choice is an advantage, but size also means students cannot wait for opportunities to find them. Course planning, office hours, counselor communication, activity depth, and workload tradeoffs all require initiative.
Course rhythm: TPHS is not CCA's 4x4
TPHS combines yearlong and semester courses, and students may schedule up to seven classes. The school says most courses meet in rotating 100-minute blocks, while one Period 1 class meets daily for 55 minutes. It also encourages many students to take six classes to preserve balance.
That structure differs from Canyon Crest Academy's compressed 4x4 schedule. TPHS's yearlong courses give students more time to absorb reading, writing, math, and lab work. At the same time, carrying six or seven courses requires sustained management of assignments, tests, athletics, and activities across the full year. Families comparing the schools can read the CCA Class of 2026 data review and the CCA–Torrey Pines address and choice-risk guide.
AP and National Merit: depth, not a mandate to overload
The School Profile reports:
| Metric | 2024 | 2025 |
|---|---|---|
| AP exams | 2,748 | 2,712 |
| Students tested | 1,123 | 1,110 |
| Qualifying scores | 89.2% | 90.1% |
For National Merit, the profile lists eight Semifinalists for 2025-26 and three Finalists for 2024-25.
These figures show consistent advanced-course participation and a visible academic top end. They do not mean every student should take a heavy AP load. The better individual questions concern English writing, math sequence, prerequisites, sleep, and GPA risk.
CTE: another important comprehensive-school pathway
TPHS is not only an AP school. The School Profile lists eight Career Technical Education pathways and 18 college-preparatory CTE courses, eight of which articulate with MiraCosta College. In spring 2025, it reports 1,904 CTE participants and 323 pathway completers.
For students who have not settled on a major, applied courses in engineering, business, digital media, and other areas can test an interest before college. A coherent CTE or project sequence may tell a stronger story than adding one more unrelated AP course. Planning should connect academic rigor, evidence of interest, and possible college fields.
College and Career Readiness: trends, not individual guarantees
The School Profile cites these CDE indicators:
| Indicator | 2023 | 2024 |
|---|---|---|
| Graduation rate | 96.6% | 96.8% |
| Completed UC/CSU A-G requirements | 78.5% | 78.6% |
| Completed college-credit coursework | 54.7% | 67.5% |
| State Seal of Biliteracy | 23.5% | 20.0% |
The increase in college-credit coursework from 54.7% to 67.5% is worth noting. It indicates broad participation in college-course opportunities, but these are school-level measures. They do not guarantee an individual GPA, course profile, or admission result.
NSC history: not the Class of 2026 destination list
Historical National Student Clearinghouse (NSC) data describes TPHS's college-going patterns:
| Destination | 2023 | 2024 |
|---|---|---|
| Two-year college | 16% | 17% |
| Four-year college | 69% | 66% |
| In-state | 49% | 49% |
| Out-of-state | 35% | 34% |
| Public | 67% | 63% |
| Private | 18% | 20% |
The school has visible UC and CSU paths, but also community-college, out-of-state public, and private-college enrollment. The 2023 and 2024 figures are historical baselines, not final Class of 2026 outcomes.
UC source-school data: UC only
The UC Information Center's Admissions by Source School dataset helps families understand TPHS's historical relationship with the UC system. Applicants, admits, and enrollees below are UC Universitywide counts.
| Fall term | Applicants | Admits | Enrollees | Admit rate | Yield |
|---|---|---|---|---|---|
| 2025 | 334 | 236 | 91 | 70.7% | 38.6% |
| 2024 | 401 | 257 | 105 | 64.1% | 40.9% |
| 2023 | 361 | 240 | 110 | 66.5% | 45.8% |
| 2022 | 357 | 210 | 96 | 58.8% | 45.7% |
| 2021 | 325 | 195 | 97 | 60.0% | 49.7% |
| 2020 | 301 | 203 | 111 | 67.4% | 54.7% |
Accurate wording is: “TPHS's 2025 UC Universitywide source-school admit rate was 70.7%.” Calling 70.7% the school's overall college admit rate would incorrectly treat the UC system as all colleges.
In the visible trend, TPHS had fewer UC applicants in 2025 than in 2024, while the admit rate rose. Yield declined from 54.7% in 2020 to 38.6% in 2025. Wider student choice, application strategy, or changing admission combinations could contribute, but the public dataset cannot establish a cause.
What did the 2026 Senior Exit Survey make public?
The TPHS Class of 2026 Senior Exit Survey asks students about post-high-school plans. Students with a confirmed destination are asked to name the school, military branch, or program they will attend and identify two-year versus four-year, public versus private, and California versus out-of-state options.
That confirms the school collected destination information. It does not make the responses public. As of this review, the public school pages did not contain aggregate results, a complete institution list, or a denominator for calculating percentages. Social-media posts, parent-group screenshots, and individual announcements remain samples, not classwide statistics.
Who is more likely to fit TPHS?
TPHS may fit students who:
- want options across academics, athletics, arts, clubs, and CTE;
- can find resources in a large school without constant adult prompting;
- prefer yearlong academic continuity to rapid 4x4 course changes;
- can maintain their own pace without defining success only through peer comparison.
Families should look more carefully when:
- a student is transitioning from a Chinese-language curriculum and still needs support in English reading, writing, or discussion;
- the family is focused on the school name but has no grades 9-12 course and activity plan;
- the student needs frequent individualized prompting and is reluctant to contact teachers or counselors;
- commute, athletics, homework, and sleep have not been placed on the same weekly schedule.
For an eighth-grade student approaching the high-school decision, read SDUHSD public high school versus private school, then use the TPHS school page to verify address, courses, and enrollment path.
FAQ
How many students are in the TPHS Class of 2026?
The TPHS 2025-2026 School Profile lists about 620 seniors. For total enrollment, the profile lists 2,615 while CDE shows 2,642 for 2025-26. Reporting dates and definitions can create small differences.
Has TPHS published the complete Class of 2026 college destination list?
As of August 21, 2026, TPHS had published its Class of 2026 Senior Exit Survey and collected final plans, but it had not posted aggregate responses or a complete matriculation list. This article therefore does not treat historical NSC data, UC data, or social-media samples as final Class of 2026 results.
Is TPHS's 2025 UC admit rate 70.7%?
The precise statement is that TPHS's 2025 UC Universitywide source-school admit rate was 70.7%. It covers the UC system only, not all colleges.
What is the largest structural difference between TPHS and CCA?
TPHS is a large comprehensive high school using yearlong and semester courses within a rotating block. CCA is a districtwide choice school using a 4x4 block. Both offer advanced opportunities, but their course rhythm, campus structure, and student-fit considerations differ.
What do families most often overlook about TPHS?
Broad resources do not guarantee that a student will use them. Families should plan the grades 9-12 course sequence, English writing development, activity direction, time management, and counselor communication instead of relying on the school name or UC statistics.
References
| Information type | Source | How this article uses it |
|---|---|---|
| Enrollment, Class of 2026, schedule, AP, National Merit, CTE, CCR, and NSC | TPHS 2025-2026 School Profile | Official school profile used for the current school snapshot and historical indicators. |
| Current course and block schedule | TPHS School Information | Used to verify yearlong and semester courses, up to seven classes, 100-minute blocks, and a daily 55-minute Period 1. |
| 2025-26 enrollment | California Department of Education school profile | CDE reports 2,642 students; presented separately from the school profile's 2,615. |
| 2026 Senior Exit Survey | TPHS Senior Info | The official page links the survey; the form collects final plans, but the public page does not provide aggregate responses. |
| UC source-school data | UC Information Center: Admissions by Source School | UC Universitywide only, not overall college admission. |
| EdCommGlobal interpretation | Cross-checking public sources and family-planning experience | Educational planning guidance, not an official school conclusion or an admission guarantee. |
Related reading
- Torrey Pines High School school page
- CCA Class of 2026 public data review
- CCA and Torrey Pines: address, boundary, and choice risk
- Grade 8: SDUHSD public high school or private school?
- San Diego school districts and public-school structure
Families who want to compare TPHS, CCA, private high schools, and the student's course foundation in one planning framework can contact EdCommGlobal.
Related reading

CCA Class of 2026 Public Data Review: AP, National Merit, and UC Source-School Context
Canyon Crest Academy's Class of 2026 has about 565 seniors. This review separates official profile data, CDE / Ed-Data context, UC source-school data, NSC history, and unofficial decision posts.

CCA vs Torrey Pines: What Class of 2026 Data Shows
Neither school publishes a complete Class of 2026 destination list. Compare CCA and TPHS using 2024 NSC, 2025 UC, course structure, and family-fit evidence.
How Competitive Is CCA? Pace, Peer Pressure, and Outcomes
See what makes CCA competitive: its 4x4 pace, high-achieving peers, course choices, and the evidence students need for college applications.